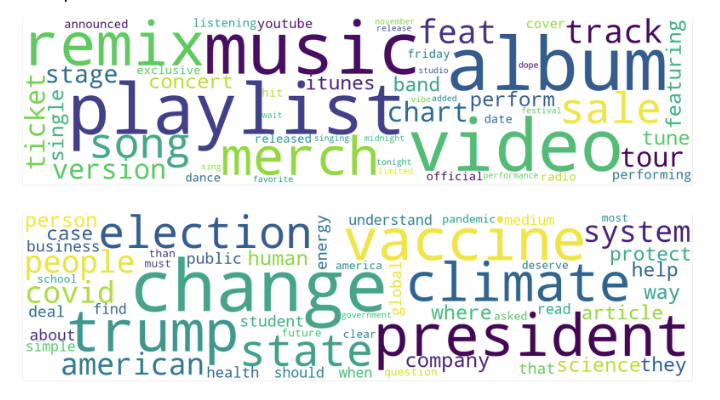
A picture says more than a thousand words..but what exactly do you want to visualize?I have seen a lot of examples of very good bus also very bad visualizations. For example a pie chart with more than 3 or 4 categories is not readable in my opinion. Because people are better at comparing lengths than areas, a bar chart is a better choice in many cases.
I am using rainbow colors only occasionally since there is no “greater than” ordering in colors so it’s hard for a human to compare quantitative data. Until now I have used Matplotlib, Seaborn, Tableau and plotly for my data visualizations with most experience in the first 3.
Need to make predictions based on historical data? Or want to explore your data for certain patterns?Machine learning is a discipline that can be applied to a lot of domains.
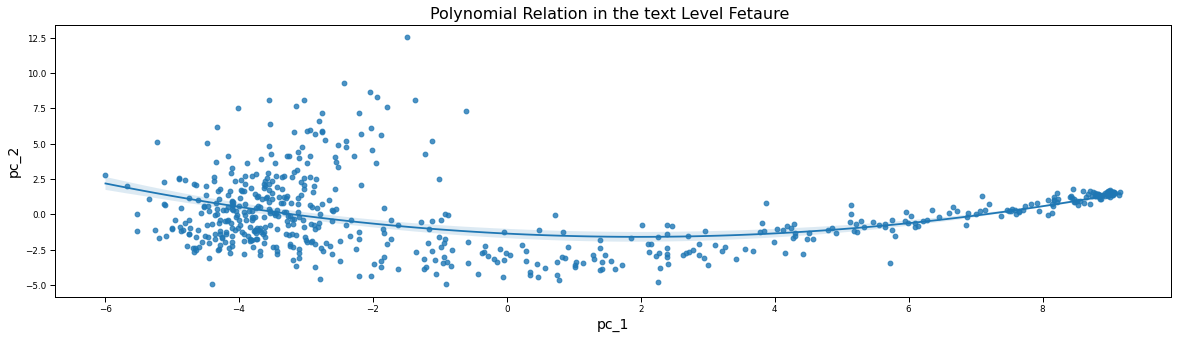
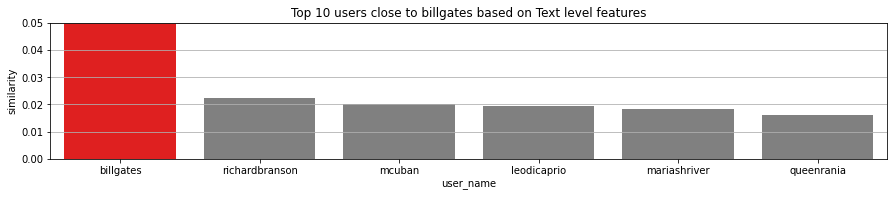
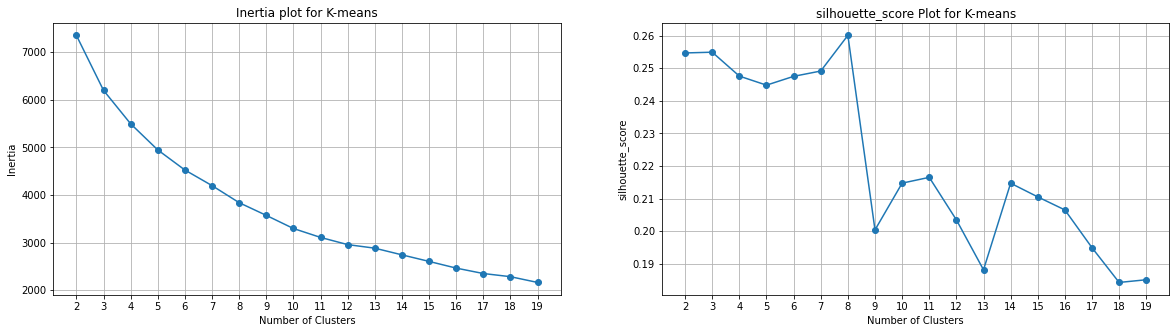
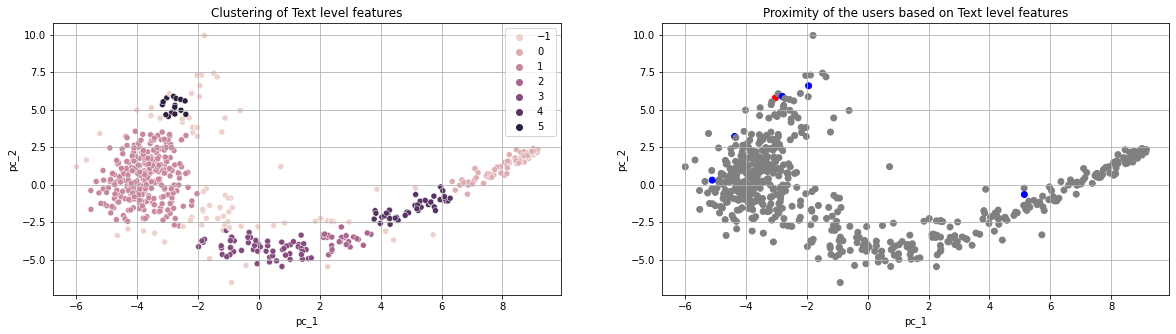
Many companies are working on self driving cars, which are all based on some sort of machine learning.I have experience with supervised, unsupervised and natural Language processing. In one of my recent projects I have for example building a feature matrix for user's historical data from twitter and developed a recommander system based on their proximity.

It's the work that happens behind the scenes to make a website look great, work fast and perform well with a seamless user experience. I have an experience in designing and developing various websites and web based applications using react framework for front end with node.js as as backend server. Interactive data management applications is one of the key areas of my expertise .Quick assist is one of my recent web based application project which helps to connect user with the home service advisers with a seamless video calling facilities.

.png)
Being a professional designer-developer and having more than 7 years of experience in academia, I had the opportunity to explore the close relationship between changing human behaviour and trends in the data. Additionally, my interest to seek for patterns in understanding a problem and weaving the same in the form of a solution has been instrumental in extending my knowledge and driving my career in DataScience.
My recent training in Data Science at Brainstation has given me a breadth of technical skills in Python, SQL, ML frameworks and big data analytics. Further, my prior experience of freelance practice has helped me in building a strong foundation to generate industry-oriented insights and develop data-driven solutions for stakeholders.
I am excited to leverage my recent training and my past experiences to contribute and explore the future challenges in the field of Data science. Please feel free to reach out if my profile resonates with you, or in case you have any questions about my projects, data, or anything in general.
If you like what you see and want to work together, get in touch!
dasgupta.sourish@gmail.com